I worked on this project to developt an instrument to monitor the flow of gas produced in anaerobic digesters for the production of biogas.
Sewage should not be seen as a problem to be eliminated, but as a source of raw materials and energy.
And one of the best alternatives “based on nature” is the production of methane from the digestion of organic matter present in sewage and organic waste in general.
An instrument that can be useful in this type of project is the measurement of the volumetric flow of gas by counting bubbles.
Initially we will test a system in which the bubble is detected by passing through a beam of infrared light. The light in the infrared region is generated by an LED and as a detector we will use a phototransistor as shown in the figure 19
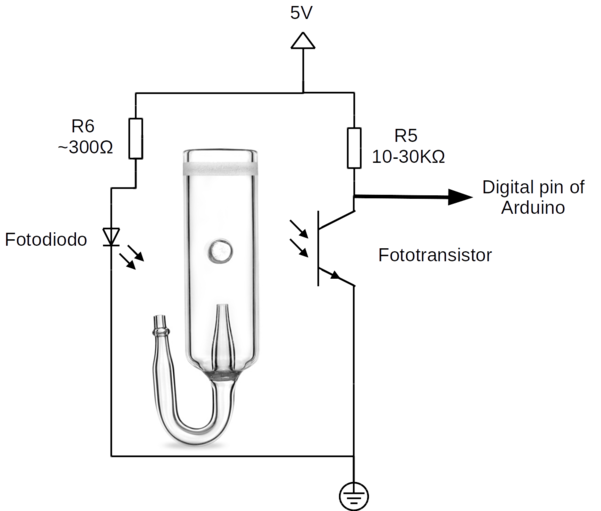
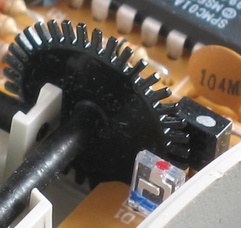
To simplify we used a phototransistor from the optical encoder of an old mouse as in figure 20
In this case the phototransistor is actually a “double phototransistor” indicated in figure 21
Figure 21. Example circuit with a dual (or double) phototransistor (Source: ENCODER OTICO/MECÂNICO CASEIRO)
We did initial tests using a small pump for aquarium aeration and observed the difficulty in generating distinct bubbles. Probably due to the effect of the surface tension of the water, it was necessary to increase the flow rate of the pump to overcome the resistance of the surface tension and start bubbling.
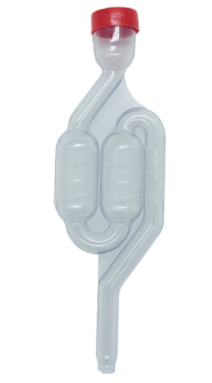
However, the flow was turbulent with a “continuous” flow of air. So we decided to test another system as shown in the figure 22.
We will need a comparator circuit to detect the passage of bubbles by variations in the signal of a photodetector. The figure 23 shows an operational amplifier being used as a “non-inverting” comparator.
Figure 23. Operational amplifier used as a “non-inverting” comparator (Source: Types of Comparators)
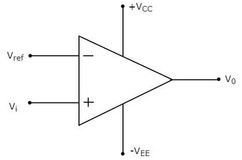
A reference voltage (Vref) is applied to the inverting input (-) and the input signal (Vi) is applied to the non-inverting input (+).
If the input signal is greater than the reference signal (Vi > Vref), the output Vo corresponds to the highest power supply signal of the operational amplifier (+VCC - internal loss of OpAmp).
But if the input signal is smaller than the reference signal (Vi < Vref) the output Vo corresponds to the minimum supply voltage of the operational amplifier (-VEE).
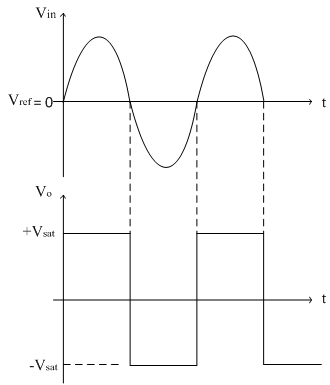
The figure 24 shows how the output signal (Vo) varies depending on the input signal (Vi).
Figure 24. Operational amplifier used as a “non-inverting” comparator (Source: Types of Comparators)
But the flow of bubbles is not regular and so the pulses generated by the phototransistor can contain many oscillations (noise). To avoid oscillations with the passage of bubbles, we will use a Schmitt Trigger comparator circuit like figure 25.
The Schmitt Trigger circuit creates a hysteresis, i.e. thresholds above and below the central mean value as shown in the figure 26.
Figure 26. Schmitt trigger circuit effect on pulse stabilization. (Source: Schmitt-trigger circuit tutorial)
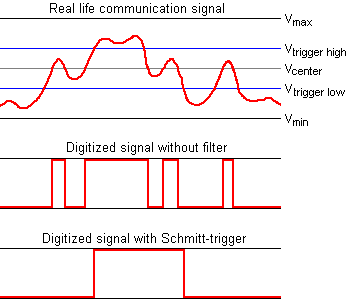
In the upper part, the red signal represents the input signal oscillating around the average transition value (Vcenter).
In the middle of the figure you can see the output signal of a comparator circuit WITHOUT the Schmitt Trigger corresponding to the variation of the input signal. In it we can see that the output signal generates a signal whenever the input signal is above the central value (Vcenter).
While the lower part of the figure shows the output signal of a comparator circuit WITH the Schmitt Trigger. In this case, the output signal is only activated when the input signal is greater than the upper limit (Vtrigger high).
And it is only deactivated when the input signal is below the lower trigger threshold (Vtrigger low).
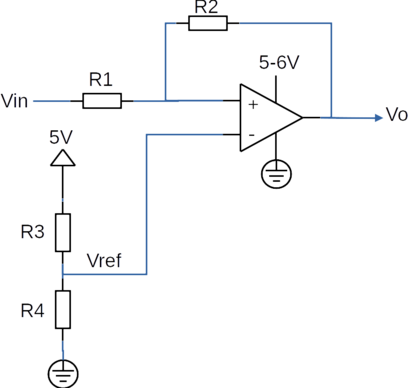
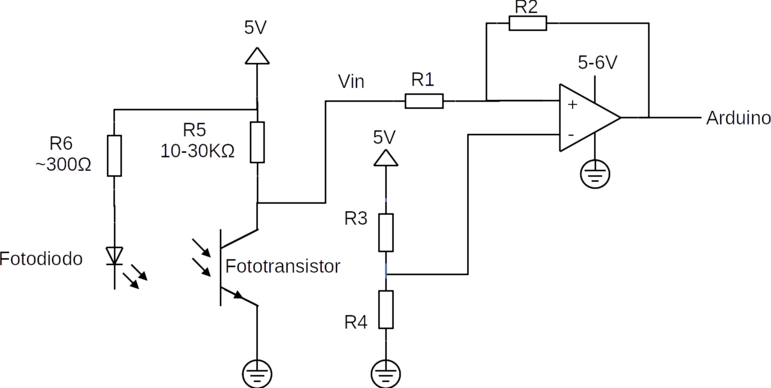
And how does a Schmitt Trigger circuit work?
The reference potential (Vref), corresponding to the potential between resistors R3 and R4, is applied to the inverting input.
The input signal Vin is applied to resistor R1 and the voltage at the non-inverting input corresponds to the voltage between resistors R1 and R2.
If the voltage at the non-inverting input is greater than the reference voltage (Vref), the AO output voltage (Vo) will be the AO supply voltage minus the internal losses.
This contributes to increasing the voltage at the non-inverting input (midpoint between R1 and R2) and thus the input voltage Vin must be “much lower” than Vref to revert Vo to the minimum value of 0V.
With Vo = 0V, the Vin signal must be “much larger” than Vref to reverse the output signal Vo.
This “delta voltage”, above and below Vref, necessary to invert the AO signal is called the “hysteresis” of the Schmitt Trigger circuit.
To simplify the work we will use a LED-IR|Phototransistor-IR pair used in an old mouse as in figure 20 and 21.
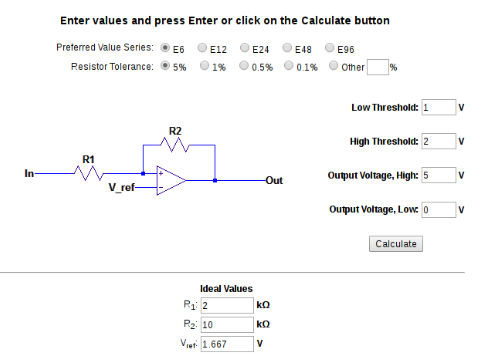
We used the calculator available at Non-Inverting Schmitt Trigger Calculator to know the values of resistance to obtain an upper limit of 2 V, a lower limit of 1 V, and a reference mean value of 1.6 V.
R1 = 2 kΩ
R2 = 10 kΩ
Vref = 1,66 V
The circuit with LED, phototransistor and Schmitt trigger is in figure 28
We use a very simple code on the Arduino board with the pulseIn function which captures the duration of a pulse on a pin (which can be HIGH - 5V or LOW - 0V).
For example, if the value “HIGH” is passed to the function, the function pulseIn() waits for the pin to go from the “LOW” state to “HIGH”, starts timing, then waits for the pin return to “LOW” state and stops timing.
Then returns the pulse size in microseconds, or gives up and returns 0 if no pulses are received within a specified maximum wait time (timeout). Can be used to measure pulses lasting from 10 microseconds to 3 minutes.
Syntax
pulseIn(pin, value)
pulseIn(pin, value, timeout)
Parameters
pin: the pin number on the Arduino where you want to capture the duration of a pulse. (int)
value: type of pulse to be read: it can be HIGH or LOW. (int)
wait_time (optional): the number of microseconds to wait for the pulse to start; the default is one second. (unsigned long)
The code we used:
int pin = 9;           //pin to read the pulse
unsigned long duration; //variable to store the pulse duration

void setup() {
  Serial.begin(9600);
  pinMode(pin, INPUT);
}

void loop() {
  duration = pulseIn(pin, HIGH);
  Serial.println(duration);
}
We developed the GUI in Tcl/Tk that receives the data sent by the Arduino through the serial port.
When opening the serial port, the program starts to receive the readings. If there are no bubbles, the Arduino board sends “0” at 1 second intervals.
The instrument can operate in 3 modes:
configuration
calibration
experiment
In “configuration” mode, the program registers the pulses, the accumulated volume and the flow rate and displays it in a table and graph but does not save it in a log file.
In “calibration” mode the program calculates the parameters of the calibration equation. For this, we use a gas flow with a known flow rate as a reference for the calibration.
And in “experiment” mode, the program saves the volume (V) and flow rate (Q) over time (t) in a log file.
In figure 29 we can see the sequence diagram of the program.
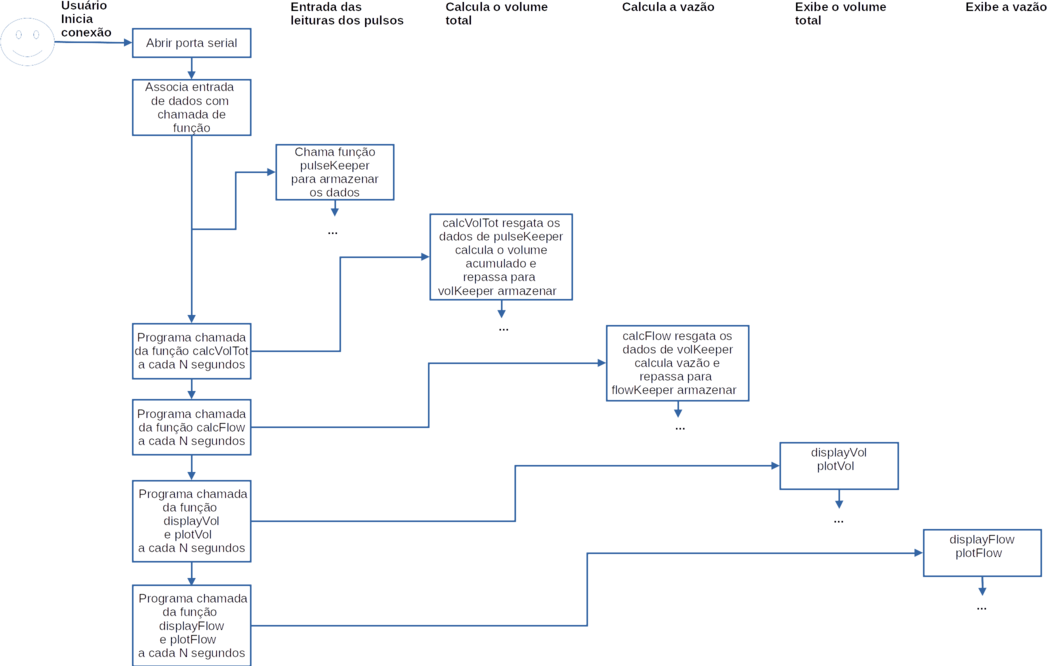
Code available to download: medidor_vazao_02.tcl.